Do you want to write your own debugger? … Do you have a new technology and see the already known products like OllyDbg or IDA Pro don’t have this technology? … Do you write plugins in OllyDbg and IDA Pro but you need to convert it into a separate application? … This article is for you.
In this article, I’m going to teach you how to write a full functional debugger using the Security Research and Development Framework (SRDF) … how to disassemble instructions, gather Process Information and work with PE Files … and how to set breakpoints and work with your debugger.
Why Debugging?
Debugging is usually used to detect application bugs and traces its execution … and also, it’s used in reverse engineering and analyzing application when you don’t have the source code of this application.
Reverse engineering is used mainly for detecting vulnerabilities, analyzing malware or cracking applications.
We will not discuss in this article how to use the debugger for these goals … but we will describe how to write your debugger using SRDF… and how you can implement your ideas based on it.
Security Research and Development Framework
This is a free open source Development Framework created to support writing security tools and malware analysis tools. And to convert the security researches and ideas from the theoretical approach to the practical implementation.
This development framework created mainly to support the malware field to create malware analysis tools and anti-virus tools easily without reinventing the wheel and inspire the innovative minds to write their researches on this field and implement them using SRDF.
In User-Mode part, SRDF gives you many helpful tools … and they are:
• Assembler and Disassembler
• x86 Emulator
• Debugger
• PE Analyzer
• Process Analyzer (Loaded DLLs, Memory Maps … etc)
• MD5, SSDeep and Wildlist Scanner (YARA)
• API Hooker and Process Injection
• Backend Database, XML Serializer
• And many more
In the Kernel-Mode part, it tries to make it easy to write your own filter device driver (not with WDF and callbacks) and gives an easy, object oriented (as much as we can) development framework with these features:
• Object-oriented and easy to use development framework
• Easy IRP dispatching mechanism
• SSDT Hooker
• Layered Devices Filtering
• TDI Firewall
• File and Registry Manager
• Kernel Mode easy to use internet sockets
• Filesystem Filter
Still the Kernel-Mode in progress and many features will be added in the near future
Gather Information about Process
If you decided to debug a running application or you start an application for debugging. You need to gather information about this process that you want to debug like:
• Allocated Memory Regions inside the process
• The Application place in its memory and the size of the application in memory
• Loaded DLLs inside the application’s memory
• Read a specific place in memory
Also, if you need to attach to a process already running … you will also need to know the Process Filename and the commandline of this application
Begin the Process Analysis
To gather the information about a process in the memory, you should create an object of cProcess class given the ProcessId of the process that you need to analyze.
cProcess myProc(792);
If you only have the process name and don’t have the process id, you can get the process Id from the ProcessScanner in SRDF like this:
cProcessScanner ProcScan;
And then get the hash of process names and Ids from ProcessList field inside the cProcessSanner Class … and this item is an object of cHash class.
cHash class is a class created to represent a hash from key and value … the relation between them are one-to-many … so each key could have many values. In our case, the key is the process name and the value is the process id. You could see more than one process with the same name running on your system. To get the first ProcessId for a process “Explorer.exe” for example … you will do this:
ProcScan.ProcessList[“explorer.exe”]
This will return a cString value includes the ProcessId of the process. To convert it into integer, you will use atoi() function … like this:
atoi(ProcScan.ProcessList[“explorer.exe”])
Getting Allocated Memory
To get the allocated memory regions, there’s a list of memory regions named MemoryMap the type of this Item is cList.
cList is a class created to represent a list of buffers with fixed size or array of a specific struct. It has a function named GetNumberOfItems and this function gets the number of items inside the list. In the following code, we will see how to get the list of Memory Regions using cList Functions.
for(int i=0; i<(int)(myProc->MemoryMap.GetNumberOfItems()) ;i++)
{
cout<<”Memory Address “<< ((MEMORY_MAP*)myProc->MemoryMap.GetItem(i))->Address;
cout << “ Size: “<<hex<<((MEMORY_MAP*)myProc->MemoryMap.GetItem(i))->Size <<endl;
}
The struct MEMORY_MAP describes a memory region inside a process … and it’s:
struct MEMORY_MAP
{
DWORD Address;
DWORD Size;
DWORD Protection;
};
In the previous code, we loops on the items of MemoryMap List and we get every memory region’s address and size.
Getting the Application Information
To get the application place in memory … you will simply get the Imagebase and SizeOfImage fields inside cProcess class like this:
cout<<”Process: “<< myProc->processName<<endl;
cout<<”Process Parent ID: “<< myProc->ParentID <<endl;
cout<< “Process Command Line: “<< myProc->CommandLine << endl;
cout<<”Process PEB:t”<< myProc->ppeb<<endl;
cout<<”Process ImageBase:t”<<hex<< myProc->ImageBase<<endl;
cout<<”Process SizeOfImageBase:t”<<dec<< myProc ->SizeOfImage<<” bytes”<<endl;
As you see, we get the most important information about the process and its place in memory (Imagebase) and the size of it in memory (SizeOfImage).
Loaded DLLs and Modules
The loaded Modules is a cList inside cProcess class with name modulesList and it represents an array of struct MODULE_INFO and it’s like this:
struct MODULE_INFO
{
DWORD moduleImageBase;
DWORD moduleSizeOfImage;
cString* moduleName;
cString* modulePath;
};
To get the loaded DLLs inside the process, this code represents how to get the loaded DLLs:
for (int i=0 ; i<(int)( myProc->modulesList.GetNumberOfItems()) ;i++)
{
cout<<”Module “<< ((MODULE_INFO*)myProc->modulesList.GetItem(i))->moduleName->GetChar();
cout <<” ImageBase: “<<hex<<((MODULE_INFO*)myProc->modulesList.GetItem(i))->moduleImageBase<<endl;
}
Read, Write and Execute on the Process
To read a place on the memory of this process, the cProcess class gives you a function named Read(…) which allocates a space into your memory and then reads the specific place in the memory of this process and copies it into your memory (the new allocated place in your memory).
DWORD Read(DWORD startAddress,DWORD size)
For writing to the process, you have another function name Write and it’s like this:
DWORD Write (DWORD startAddressToWrite ,DWORD buffer ,DWORD sizeToWrite)
This function takes the place that you would to write in, the buffer in your process that contains the data you want to write and the size of the buffer.
If the startAddressToWrite is null … Write() function will allocate a place in memory to write on and return the pointer to this place.
To only allocate a space inside the process … you can use Allocate() function to allocate memory inside the process and it’s like that:
Allocate(DWORD preferedAddress,DWORD size)
You have also the option to execute a code inside this process by creating a new thread inside the process or inject a DLL inside the process using these functions
DWORD DllInject(cString DLLFilename)
DWORD CreateThread (DWORD addressToFunction , DWORD addressToParameter)
And these functions return the ThreadId for the newly created thread.
Debugging an Application
To write a successful debugger, you need to include these features in your debugger:
• Could Attach to a running process or open an EXE file and debug it
• Could gather the register values and modify them
• Could Set Int3 Breakpoints on specific addresses
• Could Set Hardware Breakpoints (on Read, Write or Execute)
• Could Set Memory Breakpoints (on Read, Write or Execute on a specific pages in memory)
• Could pause the application while running
• Could handle events like exceptions, loading or unloading dlls or creating or terminating a thread.
In this part, we will describe how to do all of these things easily using SRDF’s Debugger Library.
Open Exe File and Debug … or Attach to a process
To Open an EXE File and Debug it:
cDebugger* Debugger = new cDebugger(“C:upx01.exe”);
Or with command line:
cDebugger* Debugger = new cDebugger(“C:upx01.exe”,”xxxx”);
if the file opened successfully, you will see IsFound variable inside cDebugger class set to TRUE. If any problems happened (file not found or anything) you will see it equal FALSE. Always check this field before going further.
If you want to debug a running process … you will create a cProcess class with the ProcessId you want and then attach the debugger to it:
cDebugger* Debugger = new cDebugger(myProc);
to begin running the application … you will use function Run() like this:
Debugger->Run();
Or you can only run one instruction using function Step() like this:
Debugger->Step();
This function returns one of these outputs (until now, could be expanded):
• DBG_STATUS_STEP
• DBG_STATUS_HARDWARE_BP
• DBG_STATUS_MEM_BREAKPOINT
• DBG_STATUS_BREAKPOINT
• DBG_STATUS_EXITPROCESS
• DBG_STATUS_ERROR
• DBG_STATUS_INTERNAL_ERROR
If it returns DBG_STATUS_ERROR, you can check the ExceptionCode Field and the debug_event Field to ge more information.
Getting and Modifying the Registers
To get the registers from the debugger … you have all the registers inside the cDebugger class like:
• Reg[0 → 7]
• Eip
• EFlags
• DebugStatus → DR7 for Hardware Breakpoints
To update them, you can modify these variables and then use function UpdateRegisters() after the modifications to take effect.
Setting Int3 Breakpoint
[raw] [/raw]
The main Debuggers’ breakpoint is the instruction “int3” which converted into byte 0xCC in binary (or native) form. The debuggers write int3 byte at the beginning of the instruction that they need to break into it. After that, when the execution reaches this instruction, the application stops and return to the debugger with exception: STATUS_BREAKPOINT.
To set an Int3 breakpoint, the debugger has a function named SetBreakpoint(…) like this:
Debugger->SetBreakpoint(0x004064AF);
You can set a UserData For the breakpoint like this:
DBG_BREAKPOINT* Breakpoint = GetBreakpoint(DWORD Address);
And the breakpoint struct is like this:
struct DBG_BREAKPOINT
{
DWORD Address;
DWORD UserData;
BYTE OriginalByte;
BOOL IsActive;
WORD wReserved;
};
So, you can set a UserData for yourself … like pointer to another struct or something and set it for every breakpoint. When the debugger’s Run() function returns DBG_STATUS_BREAKPOINT you can get the breakpoint struct DBG_BREAKPOINT by the Eip and get the UserData from inside … and manipulate your information about this breakpoint.
Also, you can get the last breakpoint by using a Variable in cDebugger Class named “LastBreakpoint” like this:
cout << “LastBp: “ << Debugger->LastBreakpoint << “n”;
To Deactivate the breakpoint, you can use function RemoveBreakpoint(…) like this:
Debugger->RemoveBreakpoint(0x004064AF);
Setting Hardware Breakpoints
Hardware breakpoints are breakpoints based on debug registers in the CPU. These breakpoints could stop on accessing or writing to a place in memory or it could stop on execution on an address. And you have only 4 available breakpoints only. You must remove one if you need to add more.
These breakpoints don’t modify the binary of the application to set a breakpoint as they don’t add int3 byte to the address to stop on it. So they could be used to set a breakpoint on packed code to break while unpacked.
To set a hardware breakpoint to a place in the memory (for access, write or execute) you can set it like this:
Debugger->SetHardwareBreakpoint(0×00401000,DBG_BP_TYPE_WRITE,DBG_BP_SIZE_2);
Debugger->SetHardwareBreakpoint(0×00401000,DBG_BP_TYPE_CODE,DBG_BP_SIZE_4);
Debugger->SetHardwareBreakpoint(0×00401000, DBG_BP_TYPE_READWRITE,DBG_BP_SIZE_1);
For code only, use DBG_BP_SIZE_1 for it. But the others, you can use size equal to 1 byte, 2 bytes or 4 bytes.
This function returns false if you don’t have a spare place for you breakpoint. So, you will have to remove a breakpoint for that.
To remove this breakpoint, you will use the function RemoveHardwareBreakpoint(…) like this:
Debugger->RemoveHardwareBreakpoint(0x004064AF);
Setting Memory Breakpoints
Memory breakpoints are breakpoints rarely to see. They are not exactly in OllyDbg or IDA Pro but they are good breakpoints. It’s similar to OllyBone.
These breakpoints are based on memory protections. They set read/write place in memory to read only if you set a breakpoint on write. Or set a place in memory to no access if you set a read/write breakpoint and so on.
This type of breakpoints has no limits but it set a breakpoint on a memory page with size 0x1000 bytes.
So, it’s not always accurate. And you have only the breakpoint on Access and the Breakpoint on write
To set a breakpoint you will do like this:
Debugger->SetMemoryBreakpoint(0×00401000,0×2000,DBG_BP_TYPE_WRITE);
When the Run() function returns DBG_STATUS_MEM_BREAKPOINT so a Memory Breakpoint is triggered. You can get the accessed memory place (exactly) using cDebugger class variable: LastMemoryBreakpoint.
You can also set a UserData like Int3 breakpoints by using GetMemoryBreakpoint(…) with any pointer inside the memory that you set the breakpoint on it (from Address to (Address + Size)). And it returns a pointer to struct “” which describe the memory breakpoint and you can add your user data in it
struct DBG_MEMORY_BREAKPOINT
{
DWORD Address;
DWORD UserData;
DWORD OldProtection;
DWORD NewProtection;
DWORD Size;
BOOL IsActive;
CHAR cReserved; //they are written for padding
WORD wReserved;
};
You can see the real memory protection inside and you can set your user data inside the breakpoint.
To remove a breakpoint, you can use RemoveMemoryBreakpoint(Address) to remove the breakpoint.
Pausing the Application
To pause the application while running, you need to create another thread before executing Run() function. This thread will call to Pause() function to pause the application. This function will call to SuspendThread to suspend the debugged thread inside the debuggee process (The process that you are debugging).
To resume again, you should call to Resume() and then call to Run() again.
You can also terminate the debuggee process by calling Terminate() function. Or, if you need to exit the debugger and makes the debuggee process continues, you can use Exit() function to detach the debugger.
Handle Events
To handle the debugger events (Loading new DLL, Unload new DLL, Creation of a new Thread and so on), you have 5 functions to get notified with these events and they are:
• DLLLoadedNotifyRoutine
• DLLUnloadedNotifyRoutine
• ThreadCreatedNotifyRoutine
• ThreadExitNotifyRoutine
• ProcessExitNotifyRoutine
You will need to inherit from cDebugger Class and override these functions to get notified on them.
To get information about the Event, you can information from debug_event variable
PE File Format
DOS MZ header |
DOS stub |
PE header |
Section table |
Section 1 |
Section 2 |
Section … |
Section n |
We will go through the PE Headers (EXE Headers) and how you could get information from it and from cPEFile class in SRDF (the PE Parser).
The EXE File begins with “MZ” characters and the DOS Header (named MZ Header). This DOS Header is for a DOS Application at the beginning of the EXE File.
This DOS Application is created to say “it’s not a win32 application” if it runs on DOS.
The MZ Header contains an offset (from the beginning of the File) to the beginning of the PE Header. The PE Header is the Real header of the Win32 Application.
PE Header |
Signature: PE,0,0 |
File Header |
Optional Header |
Data Directory |
It begins with Signature “PE” and 2 null bytes and then 2 Headers: File Header and Optional Header.
To get the PE Header in the Debugger, the cPEFile class includes the pointer to it (in a Memory Mapped File of the Process Application File) like this:
cPEFile* PEFile = new cPEFile(argv[1]);
image_header* PEHeader = PEFile->PEHeader;
The File Header contains the number of section (will be described) and contains the CPU architecture and model number that this application should run into … like Intel x86 32-Bits and so on.
Also, it includes the size of Optional Header (the Next Header) and includes The Characteristics of the Application (EXE File or DLL).
The Optional Header contains the Important Information about the PE as you see in the Table Below:
Field | Meanings |
AddressOfEntryPoint | The Beginning of the Execution |
ImageBase | The Start of the PE File in Memory (default) |
SectionAlignment | Section Alignment in Memory while mapping |
FileAlignment | Section Alignment in Harddisk (~ one sector) |
MajorSubsystemVersion MinorSubsystemVersion | The win32 subsystem version |
SizeOfImage | The Size of the PE File in Memory |
SizeOfHeaders | Sum of All Header sizes |
Subsystem | GUI, Console, driver or others |
DataDirectory | Array of pointers to important Headers |
To get this Information from the cPEFile class in SRDF … you have the following variables inside the class:
bool FileLoaded;
image_header* PEHeader;
DWORD Magic;
DWORD Subsystem;
DWORD Imagebase;
DWORD SizeOfImage;
DWORD Entrypoint;
DWORD FileAlignment;
DWORD SectionAlignment;
WORD DataDirectories;
short nSections;
DataDirectory are an Array of pointers to other Headers (optional Headers … could be found or could the pointer be null) and the size of the Header.
It Includes:
• Import Table: importing APIs from DLLs
• Export Table: exporting APIs to another Apps
• Resource Table: for icons, images and others
• Relocables Table: for relocating the PE File (loading it in a different place … different from Imagebase)
We include the parser of Import Table … as it includes an Array of All Imported DLLs and APIs like this:
cout << PEFile->ImportTable.nDLLs << “n”;
for (int i=0;i < PEFile->ImportTable.nDLLs;i++)
{
cout << PEFile->ImportTable.DLL[i].DLLName << “n”;
cout << PEFile->ImportTable.DLL[i].nAPIs << “n”;
for (int l=0;l<PEFile->ImportTable.DLL[i].nAPIs;l++)
{
cout << PEFile->ImportTable.DLL[i].API[i].APIName << “n”;
cout <<PEFile->ImportTable.DLL[i].API[i].APIAddressPlace << “n”;
}
}
After the Headers, there are the section headers. The application File is divided into section: section for code, section for data, section for resources (images and icons), section for import table and so on.
Sections are expandable … so you could see its size in the Harddisk (or the file) is smaller than what is in the memory (while loaded as a process) … so the next section place will be different from the Harddisk and the memory.
The address of the section relative to the beginning of the file in memory while loaded as a process is named RVA (Relative virtual address) … and the address of the section relative to the beginning of the file in the Harddisk is named Offset or PointerToRawData
That’s the information that the section Header gives:
Field | Meanings |
Name | The Section Name |
VirtualAddress | The RVA address of the section |
VirtualSize | The size of Section (in Memory) |
SizeOfRawData | The Size of Section (in Harddisk) |
PointerToRawData | The pointer to the beginning of file (Harddisk) |
Characteristics | Memory Protections (Execute,Read,Write) |
You can manipulate the section in cPEFile class like this:
cout << PEFile->nSections << “n”;
for (int i=0;i< PEFile->nSections;i++)
{
cout << PEFile->Section[i].SectionName << “n”;
cout << PEFile->Section[i].VirtualAddress << “n”;
cout << PEFile->Section[i].VirtualSize << “n”;
cout << PEFile->Section[i].PointerToRawData << “n”;
cout << PEFile->Section[i].SizeOfRawData << “n”;
cout << PEFile->Section[i].RealAddr << “n”;
}
The Real Address is the address to the beginning of this section in the Memory Mapped File. Or in other word, in the Opened File.
To convert RVA to Offset or Offset to RVA … you can use these functions:
DWORD RVAToOffset(DWORD RVA);
DWORD OffsetToRVA(DWORD RawOffset);
The Disassembler
To understand how to work with assemblers and disassemblers … you should understand the shape of the instructions and so on.
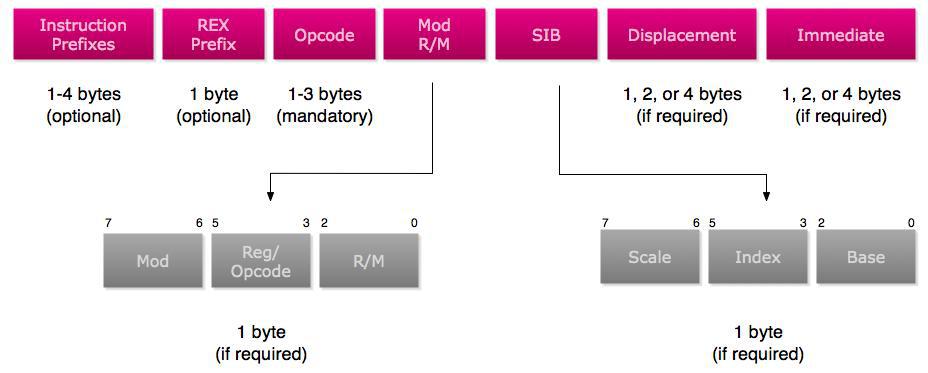
Figure 1. That’s the x86 instruction Format
• The Prefixes are reserved bytes used to describe something in the Instruction like for example:
• 0xF0: Lock Prefix … and it’s used for synchronization
• 0xF2/0xF3: Repne/Rep … the repeat instruction for string operations
• 0×66: Operand Override … for 16 bits operands like: mov ax,4556
• 0×67: Address Override … used for 16-bits ModRM … could be ignored
• 0×64: Segment Override For FS … like: mov eax, FS:[18]
• Opcodes:
• Opcode encodes information about
• operation type,
• operands,
• size of each operand, including the size of an immediate operand
• Like Add RM/R, Reg (8 bits) → Opcode: 0×00
• Opcode Could be 1 byte,2 or 3 bytes
• Opcode could use the “Reg” in ModRM as an opcode extenstion … and this named “Opcode Groups”
• Modrm: Describes the Operands (Destination and Source). And it describes if the destination or the source is register, memory address (ex: dword ptr [eax+ 1000]) or immediate (number).
• SIB: extension for Modrm … used for scaling in memory address like: dword ptr [eax*4 + ecx + 50]
• Displacement: The value inside the brackets [] … like dword ptr [eax+0x1000], so the displacement is 0×1000 … and it could be one byte, 2 bytes or 4 bytes
• Immediate: it’s value of the source or destination if any of them is a number like (move ax,1000) … so the immediate is 1000
That’s the x86 instruction Format in brief … you can find more details in Intel Reference Manual. To use PokasAsm class in SRDF for assembling and disassembling … you will create a new class and use it like this:
CPokasAsm* Asm = new CPokasAsm();
DWORD InsLength;
char* buff;
buff = Asm->Assemble(“mov eax,dword ptr [ecx+ 00401000h]”,InsLength);
cout << “The Length: “ << InsLength << “n”;
cout << “Assembling mov eax,dword ptr [ecx+ 00401000h]nn”;
for (DWORD i = 0;i < InsLength; i++)
{
cout << (int*)buff[i] << “ “;
}
cout << “nn”;
cout << “Disassembling the same Instruction Againnn”;
cout << Asm->Disassemble(buff,InsLength) << “ … and the instruction length : “ << InsLength << “nn”;
The Output:
The Length: 6
Assembling mov eax,dword ptr [ecx+ 00401000h]
FFFFFF8B FFFFFF81 00000000 00000010 00000040 00000000
Disassembling the same Instruction Again
mov eax ,dword ptr [ecx + 401000h] … and the instruction length : 6
Also, we add an effective way to retrieve the instruction information. We created a disassemble function that returns a struct describes the instruction DISASM_INSTRUCTION and it looks like:
struct DISASM_INSTRUCTION
{
hde32sexport hde;
int entry;
string* opcode;
int ndest;
int nsrc;
int other;
struct
{
int length;
int items[3];
int flags[3];
} modrm;
int (*emu_func)(Thread&,DISASM_INSTRUCTION*);
int flags;
};
The Disassemble Function looks like:
DISASM_INSTRUCTION* Disassemble(char* Buffer,DISASM_INSTRUCTION* ins);
It takes the Address of the buffer to disassemble and the buffer that the function will return the struct inside
Let’s explain this structure:
• hde: it’s a struct created by Hacker Disassembler Engine and describes the opcode … The important Fields are:
• len: The length of the instruction
• opcode: the opcode byte … if the opcode is 2 bytes so see also opcode2
• Flags: This is the flags and it has some important flags like “F_MODRM” and “F_ERROR_XXXX” (XXXX means anything here)
• Entry: unused
• Opcode: the opcode string … with class “string” not “cString”
• Other: used for mul to save the imm … other than that … it’s unused
• Modrm: it’s a structure describes what’s inside the RM (if there’s) like “[eax*2 + ecx + 6]” for example … and it looks like:
• Length: the number of items inside … like “[eax+ 2000]” contains 2 items
• Flags[3]: this describes each item in the RM and its maximum is 3 … it’s flags is:
• RM_REG: the item is a register like “[eax …”
• RM_MUL2: this register is multiplied by 2
• RM_MUL4: by 4
• RM_MUL8: by 8
• RM_DISP: it’s a displacement like “[0x401000 + …”
• RM_DISP8: comes with RM_DISP … and it means that the displacement is 8-bits
• RM_DISP16: the displacement is 16 bits
• RM_DISP32: the displacement is 32-bits
• RM_ADDR16: this means that … the modrm is in 16-bits Addressing Mode
• Items[3]: this gives the value of the item in the modrm … like if the Item is a register … so it contains the number of this register (ex: ecx → item = 1) and if the item is a displacement … so it contains the displacement value like “0×401000” and so on.
• emu_func: unused
• Flags: this flags describes the instruction … some describes the instruction shape, some describes destination and some describes the source … let’s see
• Instruction Shape: there are some flags describe the instruction like:
• NO_SRCDEST: this instruction doesn’t have source or destination like “nop”
• SRC_NOSRC: this instruction has only destination like “push dest”
• INS_UNDEFINED: this instruction is undefined in the disassembler … but you still can get the length of it from hde.len
• OP_FPU: this instruction is an FPU instruction
• FPU_NULL: means this instruction doesn’t have any destination or source
• FPU_DEST_ONLY: this means that this instruction has only a destination
• FPU_SRCDEST: this means that this instruction has a source and destination
• FPU_BITS32: the FPU instruction is in 32-bits
• FPU_BITS16: means that the FPU Instruction is in 16-bits
• FPU_MODRM: means that the instruction contains the ModRM byte
• Destination Shape:
• DEST_REG: means that the destination is a register
• DEST_RM: means that the destination is an RM like “dword ptr [xxxx]”
• DEST_IMM: the destination is an immediate (only with enter instruction”
• DEST_BITS32: the destination is 32-bits
• DEST_BITS16: the destination is 16-bits
• DEST_BITS8: the destination is 8-bits
• FPU_DEST_ST: means that the destination is “ST0” in FPU only instructions
• FPU_DEST_STi: means that the destination is “STx” like “ST1”
• FPU_DEST_RM: means that the destination is RM
• Source Shape: similar to destination … read the description in Destination flags above
• SRC_REG
• SRC_RM
• SRC_IMM
• SRC_BITS32
• SRC_BITS16
• SRC_BITS8
• FPU_SRC_ST
• FPU_SRC_STi
• ndest: this includes the value of the destination related to its type … if it’s a register … so it will contains the index of this register
if it’s an immediate … so it will have the immediate value
if it’s an RM … so it will be null
• nsrc: this includes the value of the source related to the type … see the ndest above
That’s simply the disassembler. We discussed all the items of our debugger. We discussed the Process Analyzer, the Debugger, the PE Parser and the Disassembler. We now should put all together.
Put All Together
To write a good debugger and simple also, we decided to create an interactive console application (like msfconsole in Metasploit) which takes commands like run or bp (to set a breakpoint) and so on. To create an interactive console application, we will use cConsoleApp class to create our Console App. We will inherit a class from it and begin the modification of its commands
class cDebuggerApp : public cConsoleApp
{
public:
cDebuggerApp(cString AppName);
~cDebuggerApp();
virtual void SetCustomSettings();
virtual int Run();
virtual int Exit();
};
And the Code:
cDebuggerApp::cDebuggerApp(cString AppName) : cConsoleApp(AppName)
{
}
cDebuggerApp::~cDebuggerApp()
{
((cApp*)this)->~cApp();
}
void cDebuggerApp::SetCustomSettings()
{
//Modify the intro of the application
Intro = “
***********************************n
** Win32 Debugger **n
***********************************n”;
}
int cDebuggerApp::Run()
{
//write your code here for run
StartConsole();
return 0;
}
int cDebuggerApp::Exit()
{
//write your code here for exit
return 0;
}
As you see in the previous code, we implemented 3 functions (virtual functions) and they are:
• SetCustomSettings: this function is used for modifying the setting for your application … like modify the intro for the application, include a log file, include a registry entry for the application or to include a database for the application to save data … as you can see, it’s used to write the intro.
• Run: this function is called to run the application. You should call to StartConsole to begin the interactive console
• Exit: this function is called when the user write “quit” command to the console.
The cConsoleApp implements 2 commands for you “quit” and “help”. Quit exit the application and help show the command list with their description. To add a new command you should call to this function:
AddCommand(char* Name,char* Description,char* Format,DWORD nArgs,PCmdFunc CommandFunc)
The command Func is the function which will be called when the user inputs this command … and it should be with this format:
void CmdFunc(cConsoleApp* App,int argc,char* argv[])
it’s similar to the main function added to it the App class. The argv is the list of the arguments for this function and the argc is the number of arguments (always equal to nArgs that you enter in add commands .. could be ignored as it’s reserved).
To use AddCommand … you can use it like this:
AddCommand(“dump”,”Dump a place in memory in hex”,”dump [address] [size]”,2,&DumpFunc);
The DumpFunc is like that:
void DumpFunc(cConsoleApp* App,int argc,char* argv[])
{
((cDebuggerApp*)App)->Dump(argc,argv);
};
As it calls to Dump function in the cDebuggerApp class which inherited from cConsoleApp class. We added these commands for the application:
AddCommand(“step”,”one Step through code”,”step”,0,&StepFunc);
AddCommand(“run”,”Run the application until the first breakpoint”,”run”,0,&RunFunc);
AddCommand(“regs”,”Show Registers”,”regs”,0,&RegsFunc);
AddCommand(“bp”,”Set an Int3 Breakpoint”,”bp [address]”,1,&BpFunc);
AddCommand(“hardbp”,”Set a Hardware Breakpoint”,”hardbp [address] [size (1,2,4)] [type .. 0 = access .. 1 = write .. 2 = execute]”,3,&HardbpFunc);
AddCommand(“membp”,”Set Memory Breakpoint”,”membp [address] [size] [type .. 0 = access .. 1 = write]”,3,&MembpFunc);
AddCommand(“dump”,”Dump a place in memory in hex”,”dump [address] [size]”,2,&DumpFunc);
AddCommand(“disasm”,”Disassemble a place in memory”,”disasm [address] [size]”,2,&DisasmFunc);
AddCommand(“string”,”Print string at a specific address”,”string [address] [max size]”,2,&StringFunc);
AddCommand(“removebp”,”Remove an Int3 Breakpoint”,”removebp [address]”,1,&RemovebpFunc);
AddCommand(“removehardbp”,”Remove a Hardware Breakpoint”,”removehardbp [address]”,1,&RemovehardbpFunc);
AddCommand(“removemembp”,”Remove Memory Breakpoint”,”removemembp [address]”,1,&RemovemembpFunc);
For Run Function:
int cDebuggerApp::Run()
{
Debugger = new cDebugger(Request.GetValue(“default”));
Asm = new CPokasAsm();
if (Debugger->IsDebugging)
{
Debugger->Run();
Prefix = Debugger->DebuggeeProcess->processName;
if (Debugger->IsDebugging)StartConsole();
}
else
{
cout << Intro << “nn”;
cout << “Error: File not Found”;
}
return 0;
}
As you can see, we make the application start the console while the user enters a valid filename, otherwise, return error and close the application. We will not describe all commands but commands that are the hard to implement.
void cDebuggerApp::Disassemble(int argc,char* argv[])
{
DWORD Address = 0;
DWORD Size = 0;
sscanf(argv[0], “%x”, &Address);
sscanf(argv[1], “%x”, &Size);
DWORD Buffer = Debugger->DebuggeeProcess->Read(Address,Size+16);
DWORD InsLength = 0;
for (DWORD InsBuff = Buffer;InsBuff < Buffer+ Size ;InsBuff+=InsLength)
{
cout << (int*)Address << “: “ << Asm->Disassemble((char*)InsBuff,InsLength) << “n”;
Address+=InsLength;
}
}
This function at the beginning converts the arguments from string (as the user entered) to a hexadecimal value. And then, it reads in the debugee process the memory that you need to disassemble. As you can see, we added 16 bytes to be sure that all instructions will be disassembled correctly even if one of them exceed the limits of the buffer. Then, we begin looping on the disassembling process and increment the address by the length of each instruction until we reach the limited size. The main function will call to some functions to start the application and run it:
int _tmain(int argc, char* argv[])
{
cDebuggerApp* Debugger = new cDebuggerApp(“Win32Debugger”);
Debugger->SetCustomSettings();
Debugger->Initialize(argc,argv);
Debugger->Run();
return 0;
}
Conclusion
In this article we described how to write a debugger using SRDF … and how easy to use SRDF. And we described how to analyze a PE File and how disassembling an instruction works.
No comments:
Post a Comment